
Let's talk about the differences between UA and GA4.
GA4 may seem more complex at first due to:
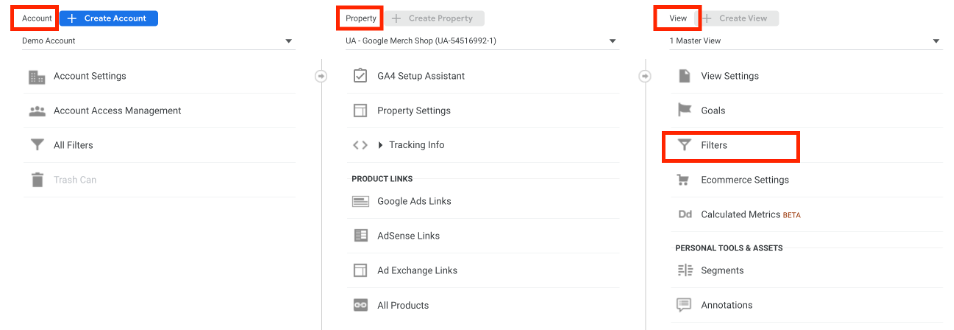
Reporting views in UA are a powerful tool that allows you to customise and filter data before it's displayed in GA reports.
You can create up to 25 reporting views in the free version of UA, which is sufficient for many users. UA users can configure reporting views based on specific business goals and measure conversions for that specific data-set.
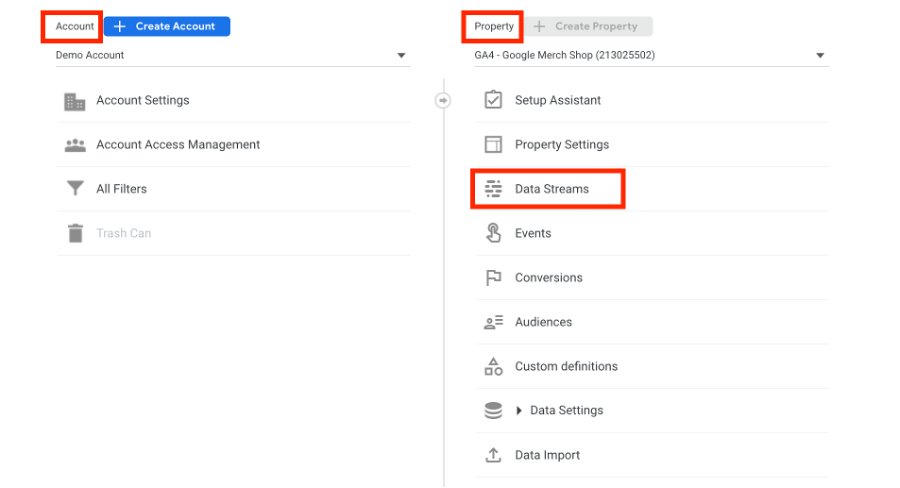
In GA4, the free version only gives you one reporting view per property that can be connected to a data stream.
A data stream in GA4 refers to the sources of data that can be set up for a website, iOS app, or Android app.
In UA, you can create multiple reporting views that allow you to customise and filter data based on specific reporting requirements. For instance, it's recommended to keep at least three reporting views in UA - raw data, main reporting, and test view. These views help filter data before it's displayed in GA reports and ensure that data isn't filtered out without a backup.
On the other hand, GA4's data model is based on Events and Parameters, which are collected and stored in a single data stream. This means that data cannot be filtered before it's collected, but limited filtering can still be applied to the data stream after collection.
It’s also worth noting that, when it comes to filtering data in GA4, at present you can only filter out internal and developer traffic. If you're a GA4 360 user, you can create sub-properties to get similar functionality as reporting views, but keep in mind that it may come with additional data processing costs.
Don't worry if you're concerned about the lack of reporting views in GA4. There are still ways to customise and filter your data as required for your analysis.
While the absence of reporting views in GA4 may seem like a limitation, there are still several ways to customise and filter your data for analysis.
In GA4, users can create custom reports that provide a tailored view of data by selecting dimensions and metrics relevant to their analysis needs. This allows for more flexibility and customisation than the predefined reports in GA4.
Users can also apply filters to the custom report to refine the data and analyse specific segments.
With custom reporting, users can achieve similar functionality to reporting views in Universal Analytics by customising their data to meet specific reporting requirements.
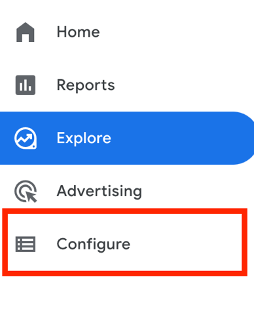
To access ‘Audiences’, navigate to the ‘Configure’ section.
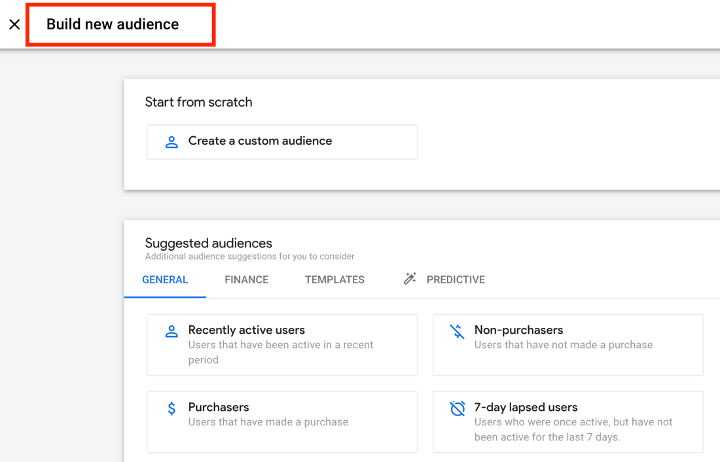
Followed by the 'Audiences' section, where you can build audience segments based on your specific requirements.
Remember that 'Audiences' data is not retroactive, meaning that data will be available from the moment you create your 'Audience'.
This is where segments can be configured, and filters applied to data-sets as required.
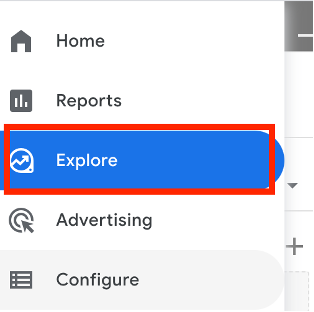
Navigate to the ‘Explore’ section, which can be found on the left-side menu.
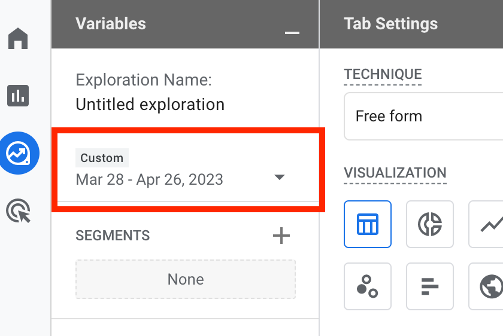
Select the date range for your report.
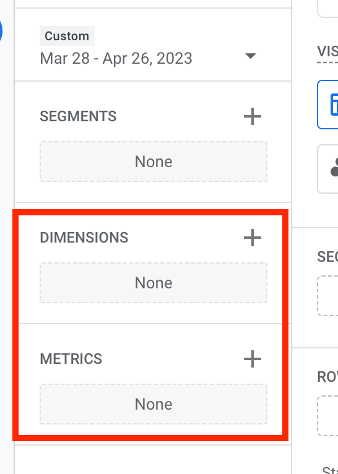
Choose the metrics and dimensions you want to include in your report.
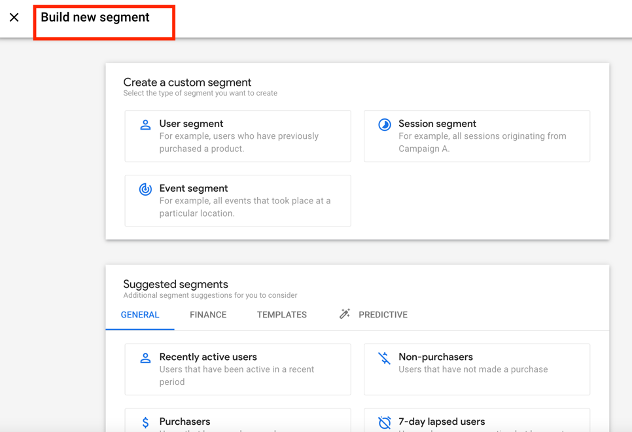
From there, you can apply any filters you want to include in your report. Filters allow you to narrow down the data you're analysing to a specific segment. To add a segment, click on the + sign in the segments section.
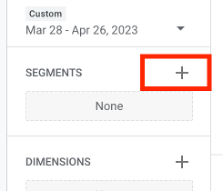
And configure your segments as required.
Once you've set up your report, you can customise it further by adding visualisations including charts, tables, or pivot tables.
Doing this means you can customise it and apply the required filters and segments to your data visualisations.
For more advanced users, data warehouses such as BigQuery allow access to raw GA4 data that can be analysed using SQL queries.
Time is running out! It's important to understand that as of 1 July 2023, all standard UA properties will stop processing new data, meaning website tracking powered by UA will automatically stop, and you might be at risk of losing your data.
By migrating to GA4 now, users can start building their data in GA4 and familiarise themselves with its reporting interface and features. If users choose not to switch to GA4, they will have no analytics data after 1 July 2023.
Contact us to understand how we can help with your GA4 migration or answer any questions.
Do Business.
Better.
Want to talk?